aktien Suche

Qualtrics International Inc. Aktie

[XM | WKN A2QLPC | ISIN US7476012015]
18,14 $ 0,00%
Echtzeit-Preisindikation
Bid: 18,14 $ Ask: 18,14 $
Unternehmensprofil

Was macht Qualtrics International Inc.?

Unternehmensprofil

Qualtrics International, Inc. operates as an experience management platform to manage customer, employee, product, and brand experiences. It operates through the following segments: CustomerXM, EmployeeXM, ProductXM and BrandXM. The CustomerXM includes a system of action that enables organizations to gain understanding across all channels that impact the customer experience and surfaces these insights in real-time to drive improvements. The EmployeeXM allows organizations to draw insights from their employees and improve experience during the employment lifecycle. The ProductXM includes design products people love, decrease time to market, and increase share of wallet by uncovering and acting on user needs, desires, and expectations. The BrandXM includes create a bedrock of loyal followers, acquire new customers, and increase market share by ensuring that brand resonates at each critical touchpoint and attracts target buyers. The company was founded by Scott M. Smith, Ryan Smith, and J

Chart der Qualtrics International Inc. Aktie

Aktuelle Nachrichten zu Qualtrics International Inc.

Weitere Nachrichten

Unsere neuesten Artikel zu Qualtrics International Inc.

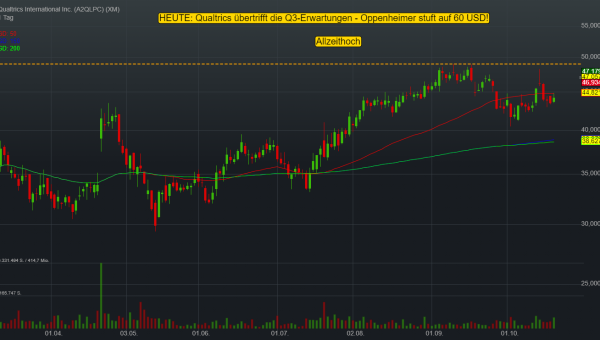
Software-Spezialist Qualtrics überzeugt mit Q3-Zahlen und Prognoseanhebung – Oppenheimer sieht 30 %iges Aufwärtspotenzial!

Qualtrics International (XM) ist eine amerikanische Tochterfirma von SAP, die erst Anfang des Jahres ihren Börsengang feierte. Das Softwareunternehmen stellt Firmen als SaaS-Modell umfassende Lösungen bereit, um mittels Datenanalyse direktes Feedback zu Produkten, Marken oder Kunden zu gewinnen oder die Produktivität der Mitarbeiter mit Automatisierungs-Tools zu steigern. DesignXM zeigt etwa auf,...

Das berichten andere über Qualtrics International Inc.

Qualtrics International Inc. Fundamentaldaten

Daten der GuV, Bilanzdaten und wichtige Kennzahlen in übersichtlichen Charts.

Umsatz- und Gewinnentwicklung (jährlich)
Dividende je Aktie im Vergleich zum Gewinn